
Skift Take
This comprehensive collection of statistics on the meetings industry will empower your conversations about the value of business events.
The Covid pandemic produced a revolution in the event industry that required planners to relearn and rethink everything from business models and sponsorship to event technology and content delivery. Whether the industry remembers it as a catalyst or catastrophe largely depends on how event professionals adapt and navigate uncertain times. Events industry statistics provide us with data that helps tell the all-important stories about the industry.
As event professionals look to forecast the industry’s future, Skift Meetings will continue to release research that takes the pulse of the industry, establishes benchmarks, and helps the industry contextualize the changes and establish trends.
The data, facts, and figures Skift Meetings has collected have been broken down to cover the topics below.
These are the events industry statistics that matter.
Covid Pandemic Recovery
- 78 percent of planners are using more technology. (Skift Meetings, 2022)
- 75 percent of planners are planning with shorter lead times. (Skift Meetings, 2022)
- 77 percent of planners find it harder to attract attendees, while 73 percent report lower attendance. (Skift Meetings, 2022)
- 70 percent of events are now hybrid or have the option to attend virtually. (Skift Meetings, 2022)
- In 2023 global exhibition revenue levels are expected to reach 94 percent of 2019 levels on average and, excluding China, up from 80 percent in 2022. (UFI, 2023)
- Decreasing budgets is the top concern for planners, followed by short lead times and supplier staffing and service issues. (Skift Meetings, 2022)
- 64 percent of planners report that their attendees are more interested in networking at events than pre-Covid-pandemic. (Skift Meetings, 2022)
- 65 percent of planners are reducing their requirements to cope with stretched budgets (Skift Meetings, 2022)
- 58 percent of planners see less value for their money than in 2019. (Skift Meetings, 2022)
- 48 percent of planners are having difficulty securing day-of staff. (Skift Meetings, 2022)
- Only 36 percent of planners secured higher budgets compared to 2019. (Skift Meetings, 2022)
Destination and Venue Selection
- The top five criteria for destination selection among planers are (in order): capacity, attractiveness, safety and security, sector expertise, and airlift. (Skift Meetings, 2022)
- The top five criteria for venue selection among planers are (in order): capacity, reputation, food and beverage quality, ease of access, and brand. (Skift Meetings, 2022)
- The top 5 meeting destinations in North America are (in order) Las Vegas, Nevada; Orlando, Florida; New York, New York; Dallas, Texas; Atlanta, Georgia. (Global Meetings and Events Forecast, 2022)
- The top 5 meeting destinations in Europe are (in order) Madrid, Spain; Barcelona, Spain; London, United Kingdom; Paris, France; Manchester, United Kingdom. (Global Meetings and Events Forecast, 2022)
- The top 5 meeting destinations in Latin America are (in order) Bogota, Colombia; Mexico City, Mexico; Cartagena, Colombia; Buenos Aires, Argentina; Cancun, Mexico. (Global Meetings and Events Forecast, 2022)
- The top 5 meeting destinations in Asia-Pacific are (in order) Tokyo, Japan; Osaka, Japan; Sydney, Australia; Seoul, South Korea; Taipei, Taiwan. (Global Meetings and Events Forecast, 2022)
Diversity, Equity and Inclusion
- 45 percent and 28 percent of event websites in North America and Europe, respectively, included information about their diversity and inclusivity policies. (EventMB, 2019)
- 99 percent of speaker panels are representative regarding the inclusion of female speakers, while the percentage of representative speaker panels in terms of BIPOC and Black speakers is 86 percent and 67 percent, respectively. (EventMB, 2020)
- 35-40 percent of events don’t even have one Black speaker. (EventMB, 2020)
Hybrid Work
- 48 percent of organizations have adopted hybrid or remote working. (Global Meetings and Events Forecast, 2022)
Jobs and Careers
- Updated in September 2020, the projected growth for meeting, convention, and event planners is expected to increase by 9 percent in the USA between 2019-2029. (The Bureau of Labor Statistics, 2020)
- $55,707 is the average event planner salary in New York City, USA (Glassdoor, 2021).
- £29,743 is the average salary for event planners in London, UK (Glassdoor, 2021).
Meeting Design
- 36 percent of planners consider engagement their biggest challenge when pivoting to virtual. (EventMB, 2020)
- 45.9 percent of planners rely on in-house production for the production aspect of their virtual events, while 32.5 percent outsource this aspect to external production companies, and 21.6 percent rely on their virtual event tech providers. (EventMB, 2020)
Mobile Event Apps
- The most-used event app feature is agenda/sessions, used by 98.3 percent of event professionals followed by the sponsors/exhibitors listing (93 percent) and the speakers listing (89.3 percent). (EventMB, 2020)
- 86 percent of mobile event apps use AI in some form, including chatbots, facial recognition, smart matchmaking, and sentiment analysis.(EventMB, 2020)
- The availability of AI-powered attendee matchmaking in event apps has increased from 41.5 percent in 2019 to to 67 percent for both proximity and non-proximity based recommendations in 2020. (EventMB, 2020)
- The availability of chatbots decreased to 16.5 percent from 22.3 percent last year. (EventMB, 2020)
- 57 percent of app providers include recommendations of nearby places, events, and experiences to attendees, while 65 percent include personalized session or content recommendations. (EventMB, 2020)
- The average maximum price of an event app is $15,000, which is up substantially from average maximum price in 2019 of $9,600. (EventMB, 2020)
- Most app companies (41 percent) charge according to features — the number of companies charging by number of attendees decreased by 9 percentage points in 2020, from 30 percent in 2019 to about 21 percent in 2020. (EventMB, 2020)
- App adoption rates overall tended to be high, with nearly 40 percent of developers stating an adoption rate of over 80 percent. Another 35 percent of developers claimed an adoption rate of 60 percent to 80 percent. (EventMB, 2020)
- About 54 percent of event app providers state that clients interact the most with the agenda on their event apps. Another 49 percent say that clients interact the most with engagement elements, like gamification, live polls and feedback, etc. (EventMB, 2020)
Return on Investment
- 76 percent of current job ads demand that event professionals be capable of establishing the business value of events. (EventMB, 2019)
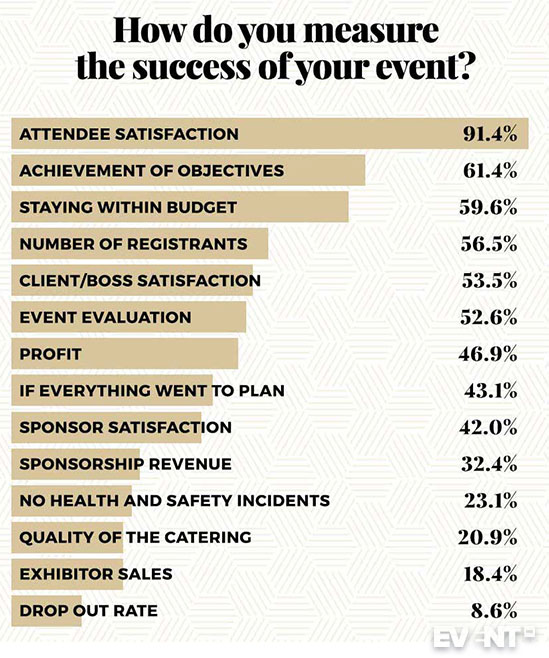
- 91 percent measure the success of their events on attendee satisfaction. 61 percent measure according to their specific event objectives and 60 percent determine results based on staying within budget. (EventMB, 2018) Graph available.
- 28 percent of event professionals were able to pivot to virtual profitably, while 10.8 percent were able to exceed their physical event. (EventMB, 2020)
- 39 percent of planners expected to be able to recoup at least 25 percent of their revenue by pivoting to virtual events in 2020. (EventMB, 2020)
- 32 percent of planners do not charge for or do not make revenue from their virtual events, which will need to change in 2021 if virtual events are to stick around. (EventMB, 2020)
Spend and Budgets
- 65 percent of meeting professionals say meeting spending is increasing. (Global Meetings and Events Forecast, 2022)
- The average daily cost of off-site internal meetings is $711 in Asia-Pacific, $662 in Latin America, $554 in Europe and the U.S. (Global Meetings and Events Forecast, 2022)
- 41.5 percentof event professionals are willing to pay up to $5,000 for virtual event tech, while only 19 percent are willing to pay more than $15,000. (EventMB, 2020)
- Expected meeting spend for 2021 in North Americais down 6 percent compared to 2020. (Global Meetings & Events Forecast, 2021).
- Given a 10 percentincrease in budget, 33 percent of event professionals would prefer to use the extra funds to improve the on-site experience, while 31 percent would increase the use of technology. (Global Meetings & Events Forecast, 2021).
Sponsorship
- In terms of sponsorship opportunities, the top three features offered by virtual event tech providers are sponsor/exhibitor profiles (78 percent), analytics/reporting (77 percent), and banners in high-traffic areas (70 percent). (EventMB, 2020)
- Sponsorships are the primary source of virtual event revenue for 23 percent of planners. (EventMB, 2020)
- Across all verticals, combo sponsorship packages dominated in 2019, making up 67 percent of all event packages and combining awareness and value offerings. (EventMB, 2019)
- Nearly 25 percent of virtual event technology providers don’t offer any analytics for proving sponsor ROI. (EventMB, 2020)
Sustainability
- 58 percent of meeting professionals report that sustainability has become more important in their role compared to pre-Covid-pandemic. (Skift Meetings, 2022)
- 50 percent of meeting professionals are taking new sustainability actions now compared to pre-Covid-pandemic. (Skift Meetings, 2022)
- Streaming experiences can reduce total climate pollution from events by 60-98 percent. (Eventcellany, 2020)
- 58 to 67 percent of event professionals are very likely or completely likely to address sustainability in their meeting plans for 2021. (Global Meetings & Events Forecast, 2021).
- 80 percent of meeting professionals say their organization considers sustainability when planning meetings and events. (Global Meetings and Events Forecast, 2022)
- 76 percent of meeting professionals have a sustainable meeting program strategy in place. (Global Meetings and Events Forecast, 2022)
Technology
- 73.6 percent of planners have become more proficient in tech due to the Covid pandemic. (EventMB, 2020)
- 53 percent of event professionals consider themselves comfortable or savvy with virtual event tech. (EventMB, 2020)
- 51.5 percent of planners say that the inability to match live engagement is the most frustrating thing when it comes to sourcing virtual event tech, and 25.4 percent say cost is the biggest challenge. (EventMB, 2020)
- Most virtual event tech providers either offer or integrate with live streaming tools or platforms (92 percent), registration tools (86 percent), and mobile event apps (80 percent). (EventMB, 2020)
- The vast majority (58 percent of virtual tech providers offer both native apps and web-based ways to access the virtual event. Nearly 32 percent of the remaining platforms offer web-based solutions that can be accessed on a browser, presumably also on mobile devices — meaning that at least 90 percent of providers allow attendees to participate on any device they choose. (EventMB, 2020)
- The top three challenges (in order) with virtual event technology are engagement, cost, and integration with the existing tech stack. (Skift Meetings, 2022)
- 46 percent of planners find the cost to be the biggest challenge when sourcing virtual event technology. (Skift Meetings, 2022)
Virtual Events
- The top five things (in order) that attract virtual event attendees are education/content, on-demand access, session time, the reputation of the event, and networking.(Skift Meetings, 2022)
- The top three challenges (in order) with virtual events are engagement, attendance, and budget. (Skift Meetings, 2022)
- 73 percent of planners were able to pivot their event to virtual successfully. (EventMB, 2020)
- 34 percent of planners consider increased attendance the most positive result of pivoting to virtual, followed by lower overhead costs (27 percent). (EventMB, 2020)
Other
- Eighty percent of employees prefer in-person brainstorming and collaborative meetings. (Meetings Mean Business, 2022)
- Globally, 67 percent of event professionals include explicit safety and security language in their meetings and events policy. (Global Meetings & Events Forecast, 2021).
Photo credit: Jason Coudriet / Unsplash


