This is a sponsored post written by Bob Vaez – President and CEO at EventMobi. More information about Event Manager Blog’s sponsored posts.
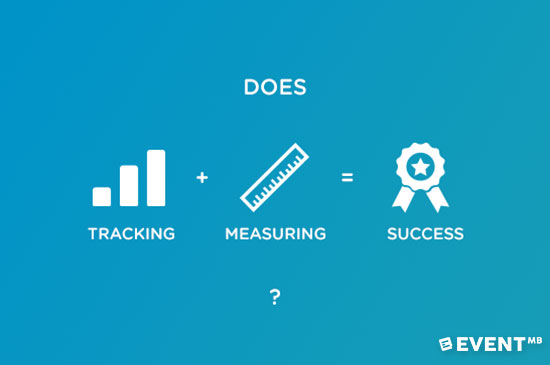
Are You Measuring Success or Just Measuring?
Have you recently thought about what true success means at your event and how you can directly or indirectly measure it? Is success measured in final ticket sales or registration numbers for your event? Maybe it’s just reducing the no-show rate for your roadshows compared to last year!
An event’s ‘Desired Outcome’ is the ultimate reason your organization has decided to invest in the event. For consumer shows it’s most likely generating profit, if it’s a product launch the ultimate goal might be lead generation or publicity for the new product measured in PR and Social Media exposure. Or in the case of a local association chapter meeting, the ultimate success factor may be to increase community involvement! Every event is different and there is no standard set of KPIs that can be used across all types of events to measure success.
At the same time with the increased adoption of event technology, marketing and event professionals are drowning in data. And even though it’s now easier to measure everything at events, it seems more difficult to extract real insight. For example we can measure event engagement indirectly by looking at activities like social impressions, app usage, retweets and gamification engagement. But does that really mean ‘success’ for your event or simply a metric to assess digital engagement? The question you should be asking is what does higher engagement mean for my event? If the desired outcome of the event was to increase networking and your group chat conversations in your event app is super busy, then you have a good metric to focus on, but if the event desired outcome was to increase new leads for your sales team the higher chat activity is not the right metric and you should focus on data from your check-in app instead.
5 Steps to Create Your Data Strategy
1) Identify Desired Event Outcome(s)
Clearly identify your event objectives like registration numbers, financial profit, increasing customer or member retention, fund raising, networking, sales, PR, client engagement, new prospects, actions post event, etc. If you have secondary objectives for your event, make sure you prioritize your list.
2) Decide on Direct and Indirect Measurements
Can you think of the best way to measure the objectives above using survey results, tools or analytics available? If not try to identify other metrics that correlates and can help you measure indirectly. For example, fund raising can be measured in amount of money collected, but networking can be indirectly measured through number of in-app private chats.
3) Set Goals and Establish Benchmarks
It’s often said “If you can measure it, you can improve it”. But remember that improvement comes when you have a clear goal or benchmark to gauge your success. Keep previous years of data as benchmarks to beat and identify action items that can help you move the needle in the right direction. Do you want 12000 tweets, 80% event app usage, need 30% of attendees as existing clients, 50% survey response or 100 new prospects? Whatever it is, write it down and make sure your entire team is in agreement and aware.
4) Qualify your Numeric Results
Numbers, analytics and data can be very powerful tools to identify trends, set goals and simplify analysis. However, they are only a part of measuring the performance of your event. If possible, always to try to ask ‘why?’ even from a small sample size.
5) Don’t Confuse Data with Feedback
Feedback you gather directly from attendees in a quantitative is different from engagement and activity data generated from event technology tools like event apps. For example, if you use a session feedback feature in your event app you can ask ‘how satisfied were you with the session?’. At the same time you can also measure the number of downloads for that session’s presentation from the app. Which one will tell you a better story about the quality of the session?
Analytics and The Insight Within Event-Technology Data
With so many technologies and tools from registration, social media platforms, event apps, audience response and in-app chat, we have access to unprecedented level of data about our events without lifting a finger. But at the same time it is essential to know how to interpret the data and what metrics are actually useful to track and which ones are just pretty graphs to fill reports. Below are a few technology tools that can provide interesting data to help you learn about your event from a different point of view:
Registration
Use social login or ask questions during the registration process to help you build out your demographic or interest list to help you filter and segment your audience. With an integrated event technology platform you can later on analyze event engagement data based on these segments during the event.
Event App
Digital engagement can go beyond just clicks and can include everything from event app usage, profile creations, tweets from app, downloading documents or how many attendees are engaged in conversation with others. This can help you identify ‘digitally’ active attendees as well as assessing your event engagement score as a whole.
Session Feedback and Event Surveys
The beauty of surveys integrated with your event app and registration is that you can send different questions to different groups of attendees. Try to curate the best questions or even split your questionnaire that are relevant to each group to help you gather more insight . Best practices for getting the most out of surveys and polls can be found here.
In-App Session Q/A
Want to find out how engaged your attendees were at a session? You don’t have to go further than analyzing the questions submitted during the session to the speaker or moderator. Now that everyone can ask questions throughout the session, this data is even more valuable than before. Use this to help measure everything from retention to engagement and also discover new topic ideas for your blog or next event
App Analytics
Event App analytics these days include a wealth of information from page views, app downloads, in-app chat usage, unique visitors, time spent in the app, documents downloaded, gamification participation, sponsors or exhibitor profile views and the list goes on. App data and analytics can indicate where attendees are spending the most time and getting the most value out of both the technology and the event. However, be mindful that some of the metrics provided by event app analytics like time spent on event app, is simply highlighting the success of app itself and not the event.
Social Metrics
There are a number of websites and services you can use to listen to your social media activity. Track your event’s hashtags to get an insight into your audience social activities, see how far your reach is beyond your attendees at the event and who’s posting most to uncover potential advocates.
Integrated Event Technology Platform
When using multiple tools you run into the fragmentation challenge where you cannot correlate your data from registration to event app to your survey results. Imagine how awesome it would be if you could uncover trends between ticket types and engagement metrics in your event app or survey results.
In Conclusion
Don’t get drowned in the data noise, start with your event objective, identify the direct and indirect metrics and work with your vendor to gather the data that can help you uncover actionable insight. Enlighten your data and analytics with real feedback and use benchmarks to progressively improve your events by measuring what matters. Use your technology tools to the fullest to automated report generation and segment your data based on your audience.
It’s time we use the power of data and feedback to confidently measure the success of events beyond ticket sales, attendance and satisfaction ratings .

March 3rd, 2016 at 11:00 AM EST